
Question 121
Case Study 1 - Litware, Inc.
Overview
Litware, Inc. is an online retailer that uses Microsoft Power Bl dashboards and reports. The company plans to leverage data from Microsoft SQL Server databases, Microsoft Excel files, text files, and several other data sources.
Litware uses Azure Active Directory (Azure AD) to authenticate users.
Existing Environment
Sales Data
Litware has online sales data that has the SQL schema shown in the following table.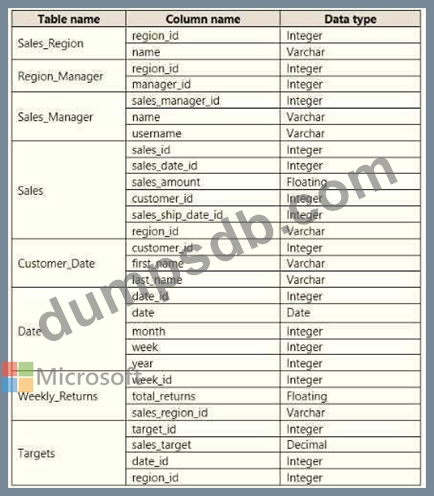
In the Date table, the dateid column has a format of yyyymmdd and the month column has a format of yyyymm. The week column in the Date table and the weekid column in the Weekly_Returns table have a format of yyyyww. The regionid column can be managed by only one sales manager.
Data Concerns
You are concerned with the quality and completeness of the sales data. You plan to verify the sales data for negative sales amounts.
Reporting Requirements
Litware identifies the following technical requirements:
- Executives require a visual that shows sales by region.
- Regional managers require a visual to analyze weekly sales and
returns.
- Sales managers must be able to see the sales data of their respective region only.
- The sales managers require a visual to analyze sales performance
versus sales targets.
- The sale department requires reports that contain the number of sales transactions.
- Users must be able to see the month in reports as shown in the
following example: Feb 2020.
- The customer service department requires a visual that can be
filtered by both sales month and ship month independently.
You need to create a relationship between the Weekly_Returns table and the Date table to meet the reporting requirements of the regional managers.
What should you do?
Question 122
Which DAX expression should you use to get the ending balances in the balance sheet reports?
Question 123
You need to create a custom visualization for Power BI.
What should you install first?
Question 124
You have an Azure SQL database that contains sales transactions. The database is updated frequently.
You need to generate reports from the data to detect fraudulent transactions. The data must be visible within five minutes of an update.
How should you configure the data connection?
Question 125
You need to create a DAX measure in the data model that only allows users to see projections at the appropriate levels of granularity.
How should you complete the measure? To answer, drag the appropriate values to the correct targets. Each value may be used once, more than once, or not at all. You may need to drag the split bar between panes or scroll to view content.
NOTE: Each correct selection is worth one point.

