
Question 121
You have a Microsoft Power BI data model that contains three tables named Sales, Product, and Date.
The Sales table has an existing measure named [Total Sales] that sums the total sales from the Sales table.
You need to write a calculation that returns the percentage of total sales that a selected ProductCategoryName value represents. The calculation must respect any slicers on ProductCategoryName and must show the percentage of visible total sales. For example, if there are four ProductCategoryName values, and a user filters one out, a table showing ProductCategoryName and the calculation must sum up to 100 percent.
How should you complete the calculation? To answer, drag the appropriate values to the correct targets. Each value may be used once, more than once, or not at all. You may need to drag the split bar between panes or scroll to view content.
NOTE: Each correct selection is worth one point.

Question 122
Note: This question is part of a series of questions that present the same scenario. Each question in the series contains a unique solution that might meet the stated goals. Some question sets might have more than one correct solution, while others might not have a correct solution.
After you answer a question in this scenario, you will NOT be able to return to it. As a result, these questions will not appear in the review screen.
You have several reports and dashboards in a workspace.
You need to grant all organizational users read access to a dashboard and several reports.
Solution: You publish an app to the entire organization.
Does this meet the goal?
Question 123
You need to create a relationship between the Weekly_Returns table and the Date table to meet the reporting requirements of the regional managers. What should you do?


Question 124
You have a Microsoft Power Bl workspace.
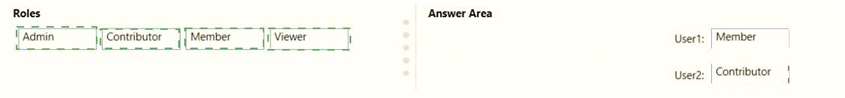
You need to grant the user capabilities shown in the following table.
The solution must use the principle of least privilege.
Which user role should you assign to each user? To answer, drag the appropriate roles to the correct users.
Each role may be used once, more than once, or not at all. You may need to drag the split bar between panes or scroll to view content.
NOTE: Each correct selection is worth one point.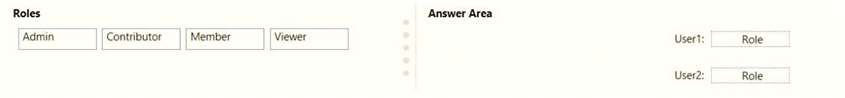
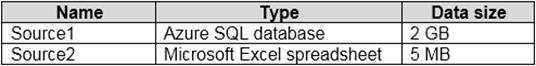
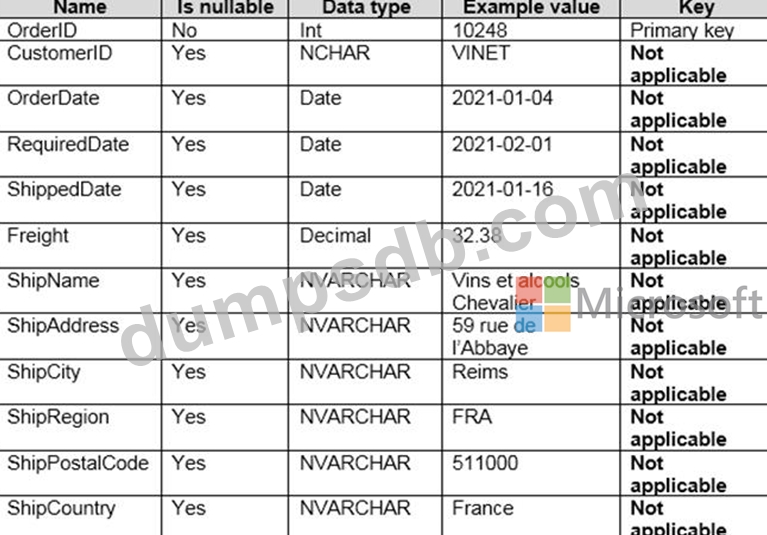
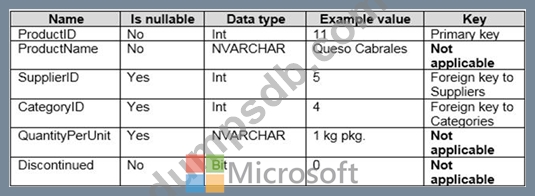
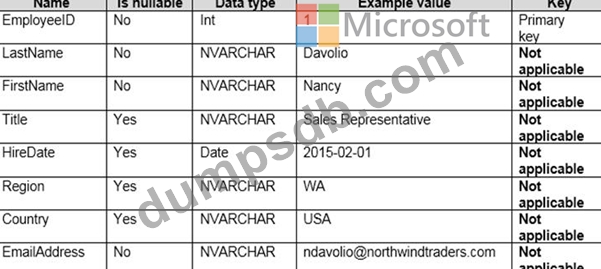
Question 125
You have the tables shown in the following table.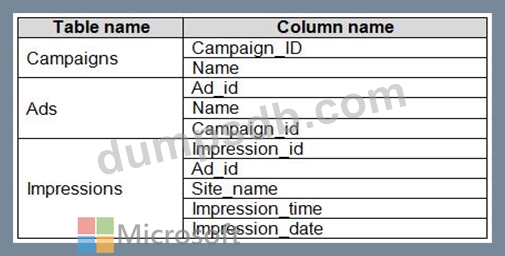
The Impressions table contains approximately 30 million records per month.
You need to create an ad analytics system to meet the following requirements:
* Present ad impression counts for the day, campaign, and Site_name. The analytics for the last year are required.
* Minimize the data model size.
Which two actions should you perform? Each correct answer presents part of the solution.
NOTE: Each correct selection is worth one point.