

DA-100 Premium Dumps
Latest DA-100 Exam Premium Dumps provide by TrainingQuiz.com to help you Passing DA-100 Exam! TrainingQuiz.com offers the updated DA-100 exam dumps, the TrainingQuiz.com DA-100 exam questions has been updated to correct Answer. Get the latest TrainingQuiz.com DA-100 pdf dumps with Exam Engine here:
(150 Q&As Dumps, 40%OFF Special Discount: DumpsDB)

Question 127
Note: This question is part of a series of questions that use the same scenario. For your convenience, the scenario is repeated in each question. Each question presents a different goal and answer choices, but the text of the scenario is the same in each question in this series.
You have a Microsoft SQL Server database that contains the following tables.
The following columns contain date information:
- Date[Month] in the mmyyyy format
- Date[Date_ID] in the ddmmyyyy format
- Date[Date_name] in the mm/dd/yyyy format
- Monthly_returns[Month_ID] in the mmyyyy format
The Order table contains more than one million rows.
The Store table has a relationship to the Monthly_returns table on the Store_ID column. This is the only relationship between the tables.
You plan to use Power BI Desktop to create an analytics solution for the data.
You are modifying the model to report on the number of orders.
You need to calculate the number of orders.
What should you do?
Question 128
You are creating a column chart visualization.
You configure groups as shown in the Groups exhibit. {Click the Groups tab.)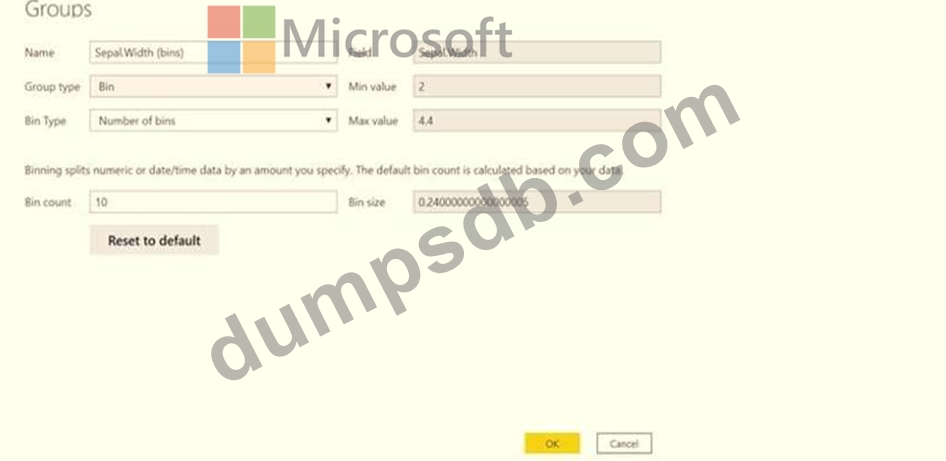
The visualization appears as shown in the Chart exhibit. (Click the Chart tab.)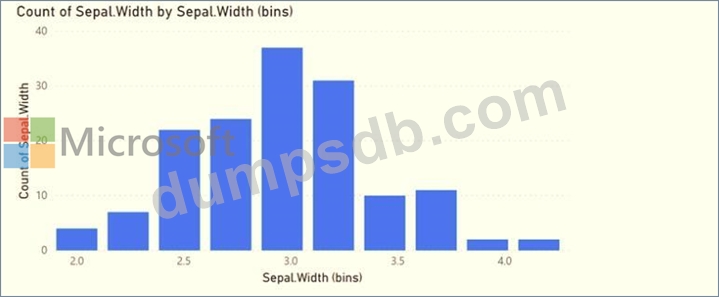
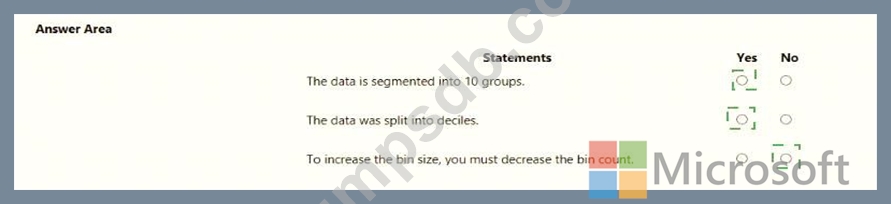
For each of the following statements, select Yes if the statement is true. Otherwise, select No.
NOTE: Each correct selection is worth one point.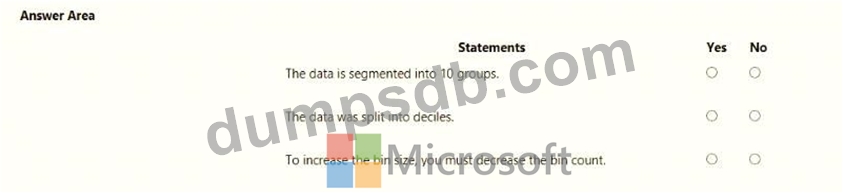
Question 129
You have a table that contains the following three columns:
* City
* Total Sales
* Occupation
You need to create a key influencers visualization as shown in the exhibit. (Click the Exhibit tab.)
How should you configure the visualization? To answer, select the appropriate options in the answer area.
NOTE: Each correct selection is worth one point.


Question 130
Hotspot Question
You are creating a quick measure as shown in the following exhibit.
You need to create a monthly rolling average measure for Sales over time.
How should you configure the quick measure calculation? To answer, select the appropriate options in the answer area.
NOTE: Each correct selection is worth one point.

Question 131
You build a report to analyze customer transactions from a database that contains the tables shown in the following table.
You import the tables.
Which relationship should you use to link the tables?