
Question 16
From the Home tab in Power BI Desktop, you click Enter Data and create a table named Sales that contains the following data.
You add Region and Sales to visualization and the visualization displays the following data.
What causes the visualization to display four rows of data instead of six?
Question 17
You are building a Power B1 report to analyze customer segments.
You need to identify customer segments dynamically based on the Bounce Rate across dimensions such as source, geography, and demographics. The solution must minimize analysis effort.
Which type of visualization should you use?
Question 18
You create a dataset sourced from dozens of flat files in Azure Blob storage. The dataset uses incremental refresh.
From powerbi.com, you deploy the dataset and several related reports to Microsoft Power BI Premium capacity.
You discover that the dataset refresh fails after the refresh runs out of resources.
What is a possible cause of the issue?
Question 19
You need to create a visualization to meet the reporting requirements of the sales managers.
How should you create the visualization? To answer, select the appropriate options in the answer area.
NOTE: Each correct selection is worth one point.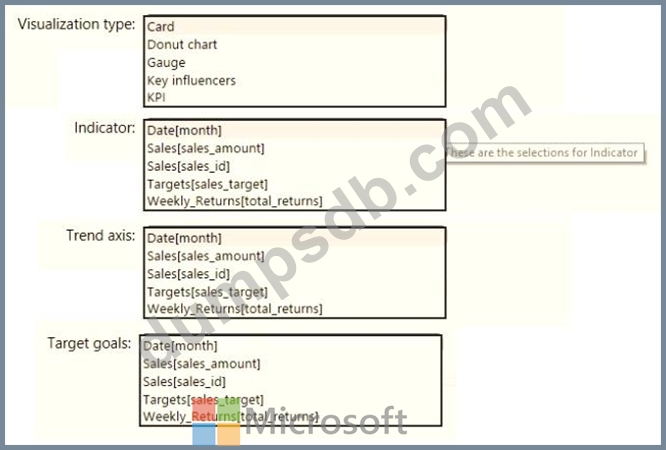

Question 20
Your company has employees in 10 states.
The company recently decided to associate each state to one of the following three regions: East, West, and North.
You have a data model that contains employee information by state. The model does NOT include region information.
You have a report that shows the employees by state.
You need to view the employees by region as quickly as possible.
What should you do?