Question 91
HOTSPOT
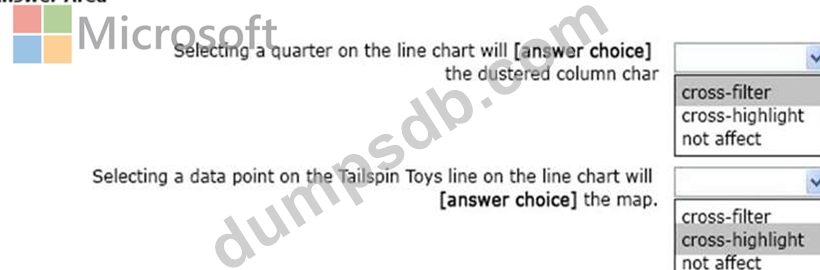
You have a report page that contains the visuals shown in the following exhibit.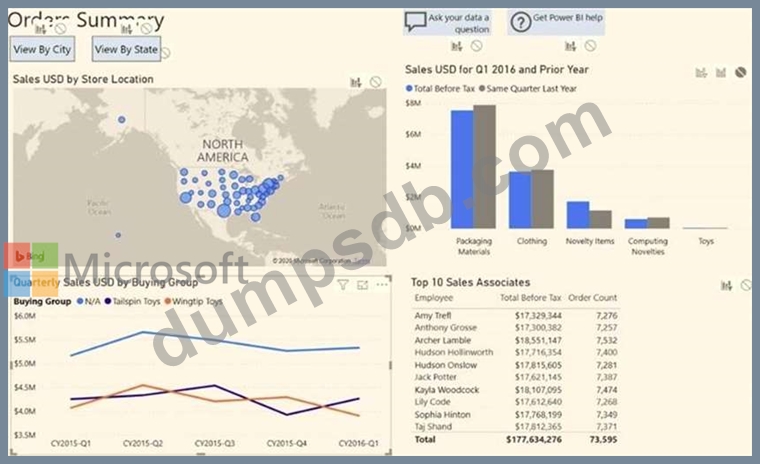
Use the drop-down menus to select the answer choice that completes each statement based on the information presented in the graphic. NOTE: Each correct selection is worth one point.
Question 92
Note: This question is a part of a series of questions that present the same scenario. For your convenience, the scenario is repeated in each question. Each question presents a different goal and answer choices, but the text of the scenario is exactly the same in each question in this series.
Start of repeated scenario
You have a Microsoft SQL Server database that has the tables shown in the Database Diagram exhibit. (Click the Exhibit.)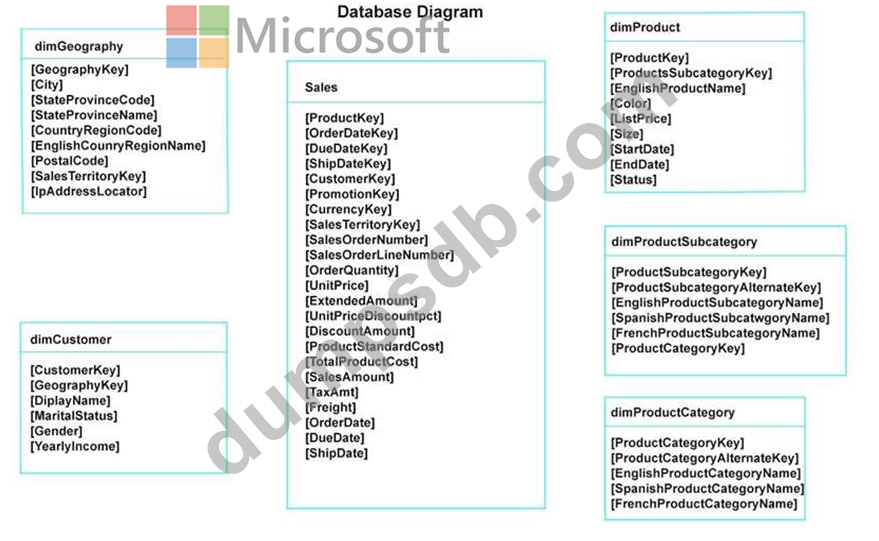
You plan to develop a Power BI model as shown in the Power BI Model exhibit. (Click the Exhibit).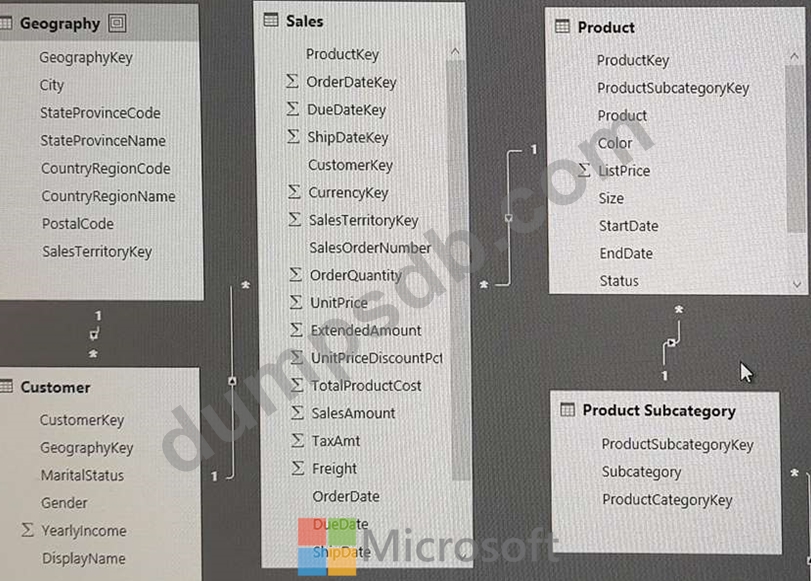
You plan to use Power BI to import data from 2013 to 2015.
Product Subcategory [Subcategory] contains NULL values.
End of repeated scenario.
You implement the Power BI model.
You need to add a new column to the Product Subcategory table that uses the following formula.
=if [Subcategory] =null then "NA" else [Subcategory]
Which command should you use in Query Editor?
Question 93
You need to create a visual as shown in the following exhibit.
The indicator color for Total Sales will be based on % Growth to Last Year.
The solution must use the existing calculations only.
How should you configure the visual? To answer, select the appropriate options in the answer area.
NOTE: Each correct selection is worth one point.

Question 94
Note: This question is part of a series of questions that present the same scenario. Each question in the series contains a unique solution that might meet the stated goals. Some question sets might have more than one correct solution, while others might not have a correct solution.
After you answer a question in this scenario, you will NOT be able to return to it. As a result, these questions will not appear in the review screen.
You have several reports and dashboards in a workspace.
You need to grant all organizational users read access to a dashboard and several reports.
Solution: You create an Azure Active Directory group that contains all the users. You share each report and dashboard to the group.
Does this meet the goal?
Question 95
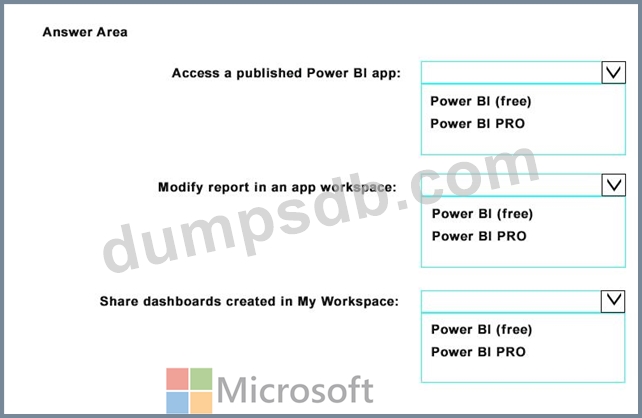
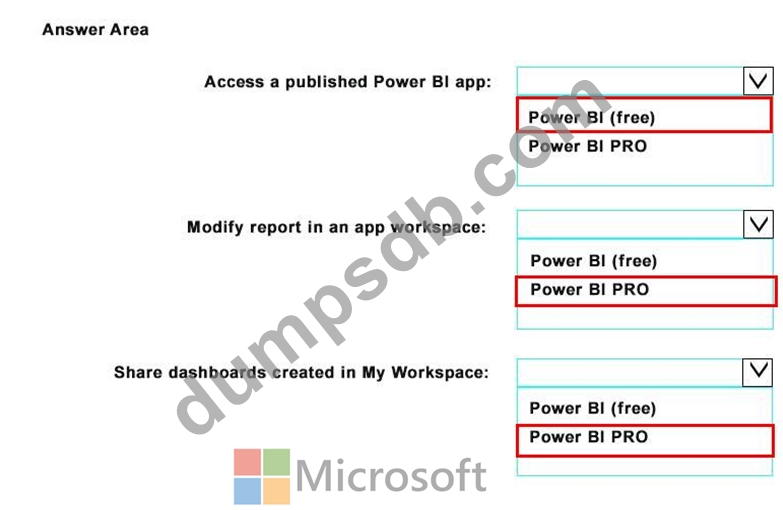
Your company plans to use Power BI for 20 users in the sales department. The users will perform the following tasks:
Access a published Power BI app
Modify reports in an app workspace
Share dashboards created in My Workspace
You need to identify which Power BI licenses are required for the tasks. The solution must use the Power BI (free) licenses, whenever possible.
Which license should you identify for each task? To answer, select the appropriate options in the answer area.
NOTE: Each correct selection is worth one point.