
Question 51
You build a report to analyze customer transactions from a database that contains the tables shown in the following table.
You import the tables.
Which relationship should you use to link the tables?
Question 52
Note: This question is part of a series of questions that use the same scenario. For your convenience, the scenario is repeated in each question. Each question presents a different goal and answer choices, but the text of the scenario is the same in each question in this series.
You have a Microsoft SQL Server database that contains the following tables.
The following columns contain date information:
- Date[Month] in the mmyyyy format
- Date[Date_ID] in the ddmmyyyy format
- Date[Date_name] in the mm/dd/yyyy format
- Monthly_returns[Month_ID] in the mmyyyy format
The Order table contains more than one million rows.
The Store table has a relationship to the Monthly_returns table on the Store_ID column. This is the only relationship between the tables.
You plan to use Power BI Desktop to create an analytics solution for the data.
You need to create a chart that displays a sum of Order[Order_amount] by month for the Order_ship_date column and the Order_date column.
How should you model the data?
Question 53
You have a Power BI report that is configured to use row-level security (RLS).
You have the following roles:
- A manager role that limits managers to see only the sales data from
the stores they manage
- A region role that limits users to see only the data from their
respective region
You plan to use Power BI Embedded to embed the report into an application. The application will authenticate the users.
You need to ensure that RLS is enforced when accessing the embedded report.
What should you do?
Question 54
Your company has affiliates who help the company acquire customers.
You build a report for the affiliate managers at the company to assist them in understanding affiliate performance.
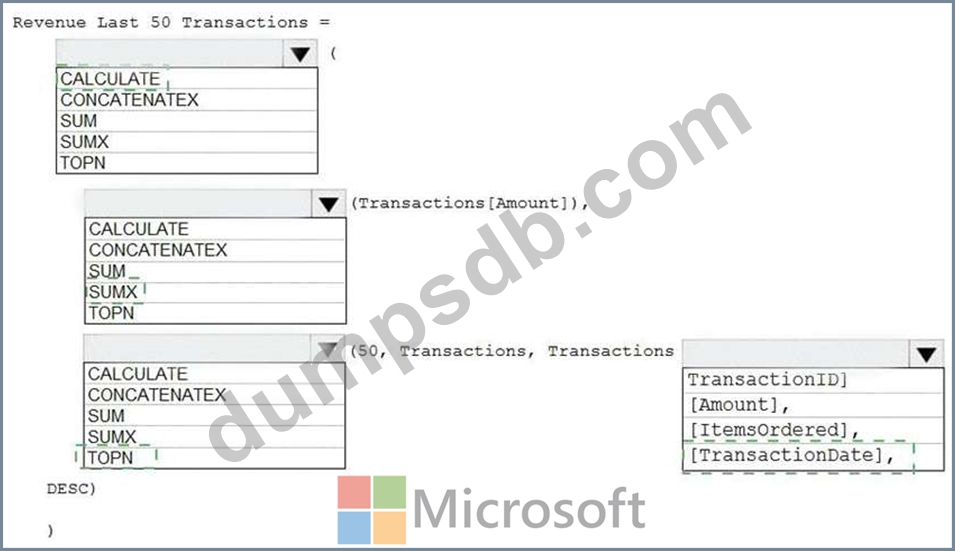
The managers request a visual showing the total sales value of the latest 50 transactions for each affiliate. You have a data model that contains the following tables.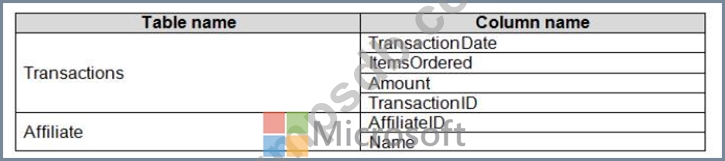
You need to develop a measure to support the visual.
How should you complete the DAX expression? To answer, select the appropriate options in the answer area.
NOTE: Each correct selection is worth one point.

Question 55
Case Study 1 - Litware, Inc.
Overview
Litware, Inc. is an online retailer that uses Microsoft Power Bl dashboards and reports. The company plans to leverage data from Microsoft SQL Server databases, Microsoft Excel files, text files, and several other data sources.
Litware uses Azure Active Directory (Azure AD) to authenticate users.
Existing Environment
Sales Data
Litware has online sales data that has the SQL schema shown in the following table.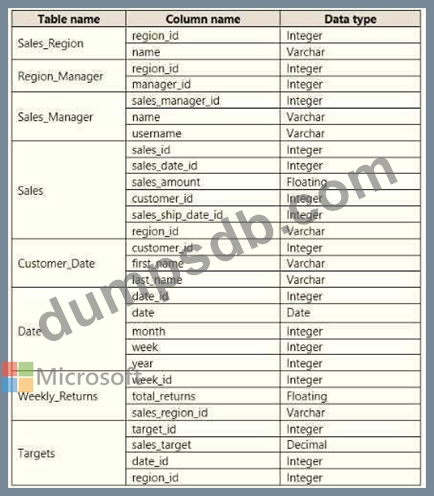
In the Date table, the dateid column has a format of yyyymmdd and the month column has a format of yyyymm. The week column in the Date table and the weekid column in the Weekly_Returns table have a format of yyyyww. The regionid column can be managed by only one sales manager.
Data Concerns
You are concerned with the quality and completeness of the sales data. You plan to verify the sales data for negative sales amounts.
Reporting Requirements
Litware identifies the following technical requirements:
- Executives require a visual that shows sales by region.
- Regional managers require a visual to analyze weekly sales and
returns.
- Sales managers must be able to see the sales data of their respective region only.
- The sales managers require a visual to analyze sales performance
versus sales targets.
- The sale department requires reports that contain the number of sales transactions.
- Users must be able to see the month in reports as shown in the
following example: Feb 2020.
- The customer service department requires a visual that can be
filtered by both sales month and ship month independently.
What should you create to meet the reporting requirements of the sales department?