Question 26
You have a Microsoft Power Bl dashboard. The report used to create the dashboard uses an imported dataset from a Microsoft SQL Server data source. The dashboard is shown in the exhibit. (Click the Exhibit tab.)
What occurred at 12:03:06 PM?
Question 27
You have a table that contains the following three columns:
City
Total Sales
Occupation
You need to create a key influencers visualization as shown in the exhibit. (Click the Exhibit tab.)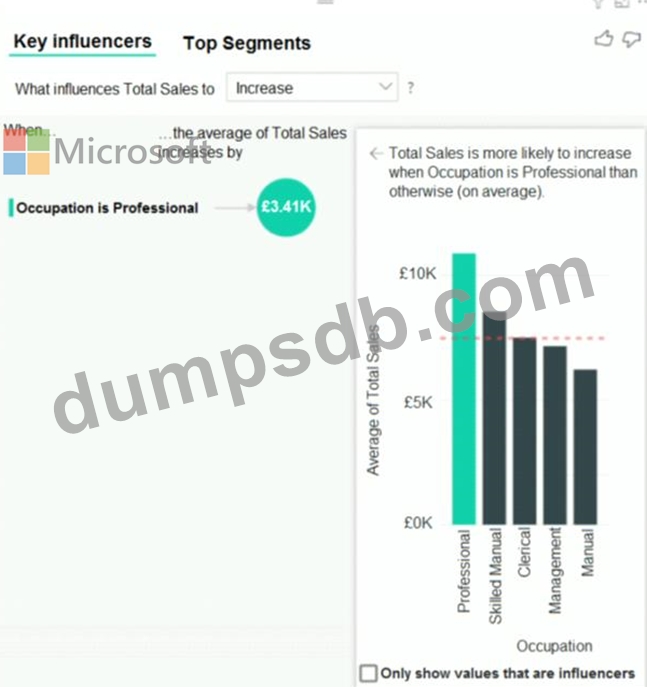
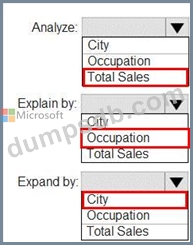
How should you configure the visualization? To answer, select the appropriate options in the answer area.
NOTE: Each correct selection is worth one point.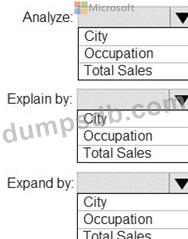
Question 28
You have a Microsoft SharePoint Online site that contains several document libraries. One of the document libraries contains manufacturing reports saved as Microsoft Excel files. All the manufacturing reports have the same data structure.
You need to load only the manufacturing reports to a table for analysis.
What should you do in Microsoft Power Bl Desktop?
Question 29
You have a Microsoft Power Bl dashboard.
You need to ensure that consumers of the dashboard can give you feedback that will be visible to the other consumers of the dashboard.
What should you use?
Question 30
You have two Azure SQL databases that contain the same tables and columns.
For each database, you create a query that retrieves data from a table named Customers.
You need to combine the Customer tables into a single table. The solution must minimize the size of the data model and support scheduled refresh in powerbi.com.
What should you do? To answer, select the appropriate options in the answer area.
NOTE: Each correct selection is worth one point.