
Question 1
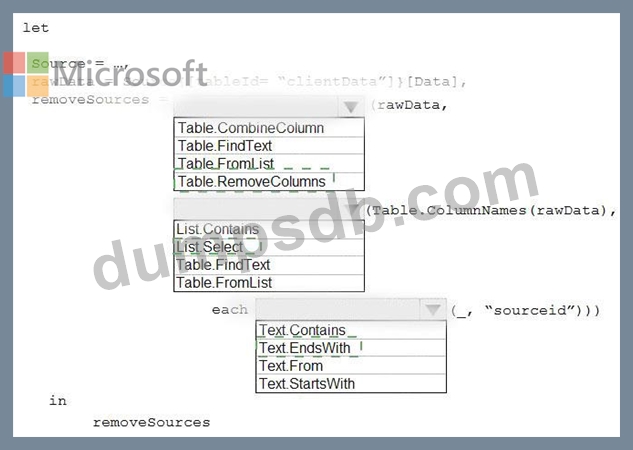
You have an API that returns more than 100 columns. The following is a sample of column names.
* client_notified_timestamp
* client_notified_source
* client_notified_sourceid
* client_notified_value
* client_responded_timestamp
* client_responded_source
* client_responded_sourceid
* client_responded_value
You plan to include only a subset of the returned columns.
You need to remove any columns that have a suffix of sourceid.
How should you complete the Power Query M code? To answer, select the appropriate options in the answer area.
NOTE: Each correct selection is worth one point.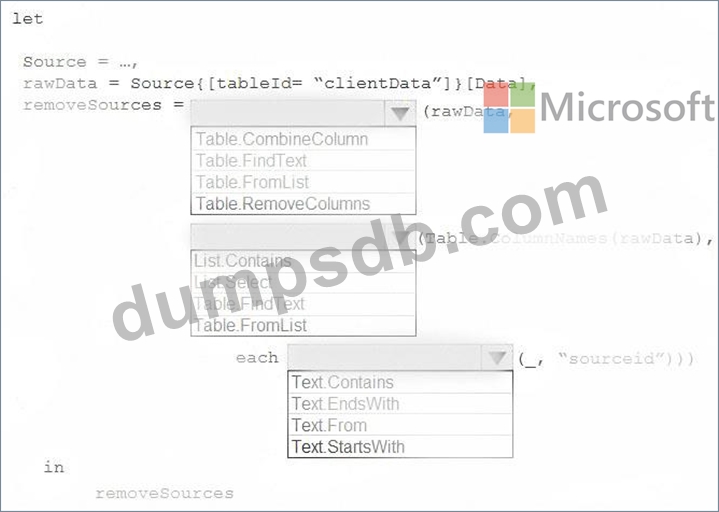
Question 2
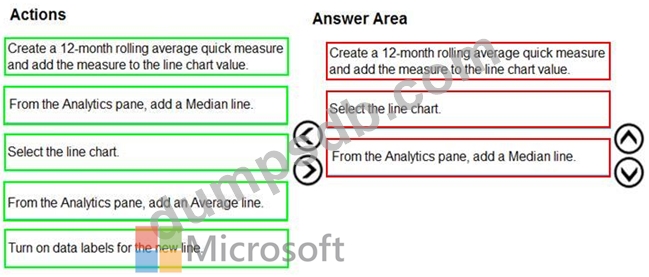
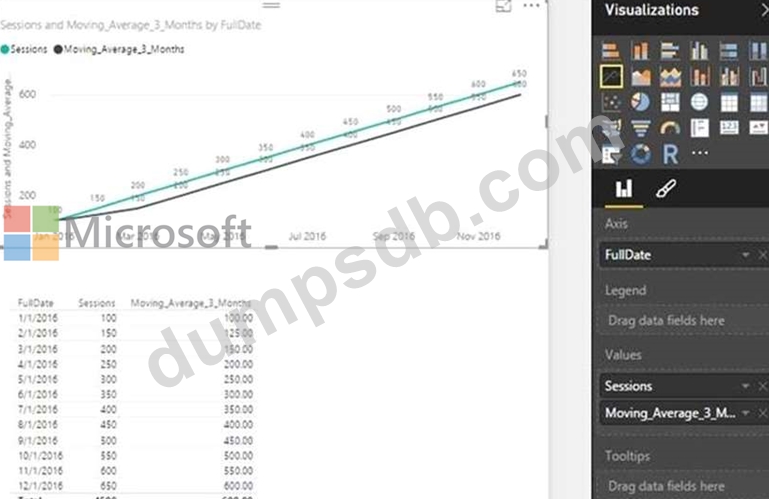
You have the line chart shown in the exhibit. (Click the Exhibit tab.)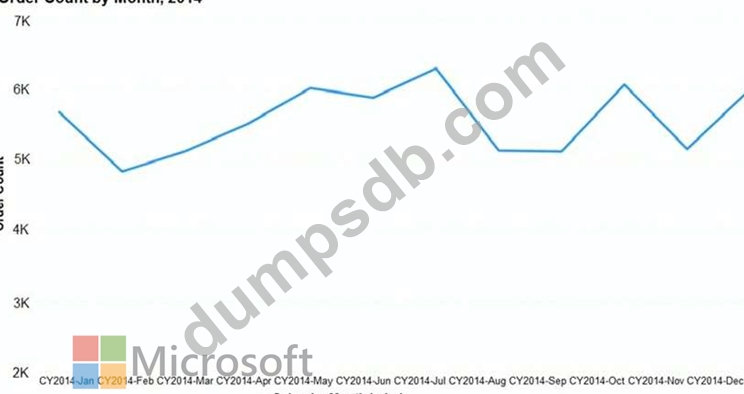
You need to modify the chart to meet the following requirements:
* Identify months that have order counts above the mean.
* Display the mean monthly order count.
Which three actions should you perform in sequence? To answer, move the appropriate actions from the list of actions to the answer area and arrange them in the correct order.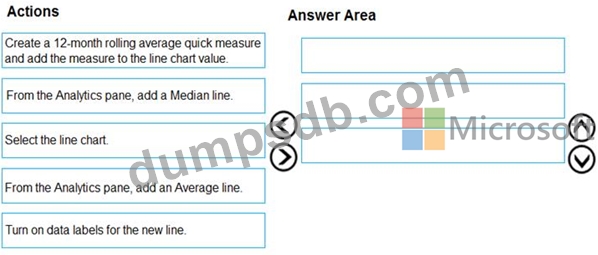
Question 3
You have a report that includes a card visualization.
You need to apply the following conditional formatting to the card while minimizing design effort.
For values that are greater than or equal to 100, the font of the data label must be dark red.
For values that are less than 100, the font of the data label must be dark gray.
Which type of format should you use?
Question 4
You publish a report to a workspace named Customer Services. The report identifies customers that have potential data quality issues that must be investigated by the customer services department of your company.
You need to ensure that customer service managers can create task lists in Microsoft Excel based on the data.
Which report setting should you configure?
Question 5
Which two types of visualizations can be used in the balance sheet reports to meet the reporting goals?
Each correct answer presents part of the solution.
NOTE: Each correct selection is worth one point.