
Question 16
You are creating an analytics report that will consume data from the tables shown in the following table.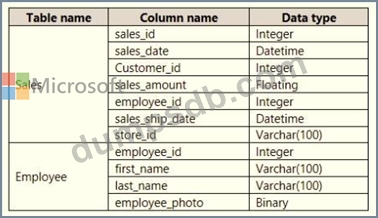
There is a relationship between the tables.
There are no reporting requirements on employeejd and employee_photo.
You need to optimize the data model
What should you configure for employeejd and employee.photo? To answer, select the appropriate options in the answer area.

Question 17
You are configuring a Microsoft Power Bl data model to enable users to ask natural language questions by using Q&A.
You have a table named Customer that has the following measure.
Customer Count = DISTINCTCOUNT(Customer[CustomerID])
Users frequently refer to customers as subscribers.
You need to ensure that the users can get a useful result for "subscriber count" by using Q&A.
The solution must minimize the size of the model.
What should you do?
Question 18
You are creating a quick measure as shown in the following exhibit.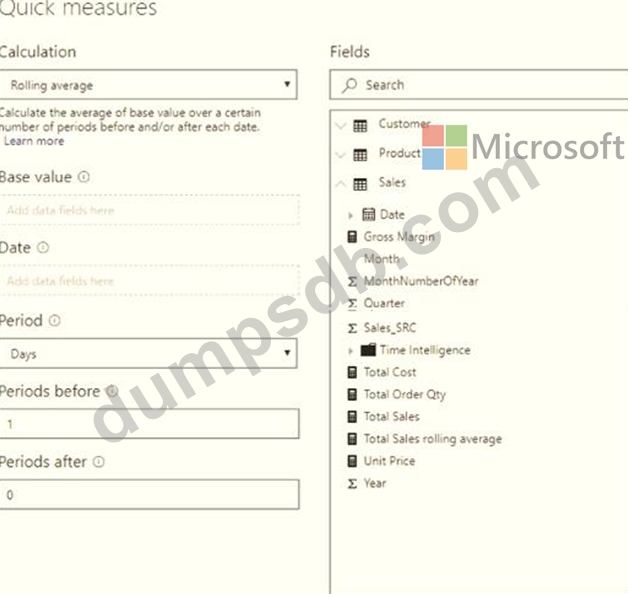
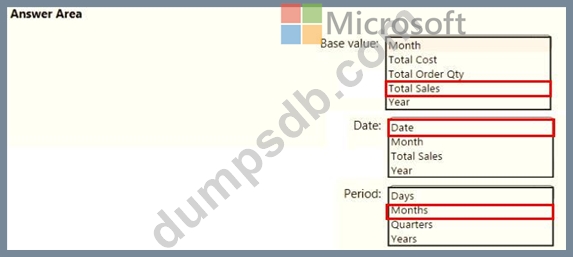
You need to create a monthly rolling average measure for Sales over time-How should you configure the quick measure calculation? To answer, select the appropriate options in the answer area.
NOTE: Each correct selection is worth one point.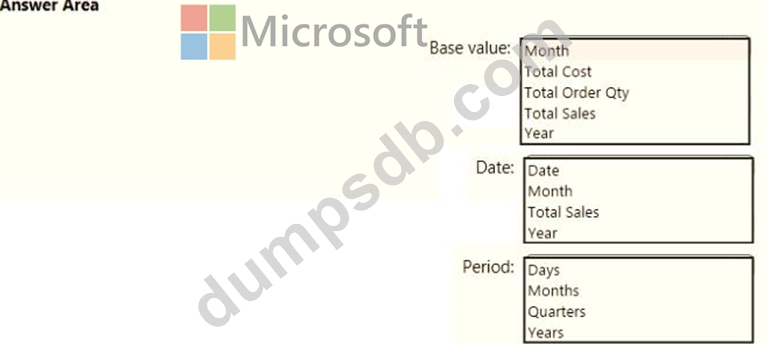
Question 19
Case Study 1 - Litware, Inc.
Overview
Litware, Inc. is an online retailer that uses Microsoft Power Bl dashboards and reports. The company plans to leverage data from Microsoft SQL Server databases, Microsoft Excel files, text files, and several other data sources.
Litware uses Azure Active Directory (Azure AD) to authenticate users.
Existing Environment
Sales Data
Litware has online sales data that has the SQL schema shown in the following table.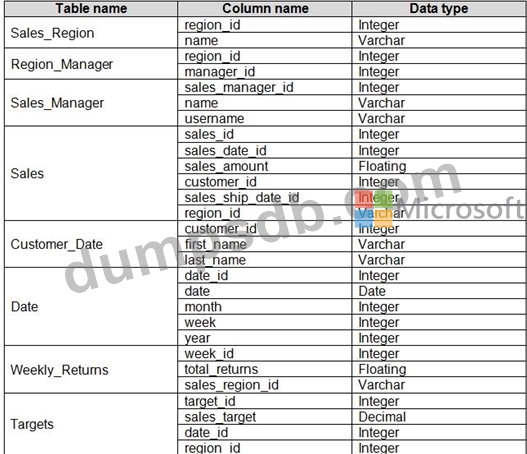
In the Date table, the dateid column has a format of yyyymmdd and the month column has a format of yyyymm. The week column in the Date table and the weekid column in the Weekly_Returns table have a format of yyyyww. The regionid column can be managed by only one sales manager.
Data Concerns
You are concerned with the quality and completeness of the sales data. You plan to verify the sales data for negative sales amounts.
Reporting Requirements
Litware identifies the following technical requirements:
- Executives require a visual that shows sales by region.
- Regional managers require a visual to analyze weekly sales and
returns.
- Sales managers must be able to see the sales data of their respective region only.
- The sales managers require a visual to analyze sales performance
versus sales targets.
- The sale department requires reports that contain the number of sales transactions.
- Users must be able to see the month in reports as shown in the
following example: Feb 2020.
- The customer service department requires a visual that can be
filtered by both sales month and ship month independently.
You need to provide a solution to provide the sales managers with the required access.
What should you include in the solution?
Question 20
Which DAX expression should you use to get the ending balances in the balance sheet reports?
CALCULATE (