Question 16
You have a Power BI dashboard that monitors the quality of manufacturing processes. The dashboard contains the following elements:
A line chart that shows the number of defective products manufactured by day.
A KPI visual that shows the current daily percentage of defective products manufactured.
You need to be notified when the daily percentage of defective products manufactured exceeds 3%.
What should you create?
Question 17
Once the profit and loss dataset is created, which four actions should you perform in sequence to ensure that the business unit analysts see the appropriate profit and loss data? To answer, move the appropriate actions from the list of actions to the answer area and arrange them in the correct order.

Question 18
You need to create a visualization to meet the reporting requirements of the sales managers.
How should you create the visualization? To answer, select the appropriate options in the answer area.
NOTE: Each correct selection is worth one point.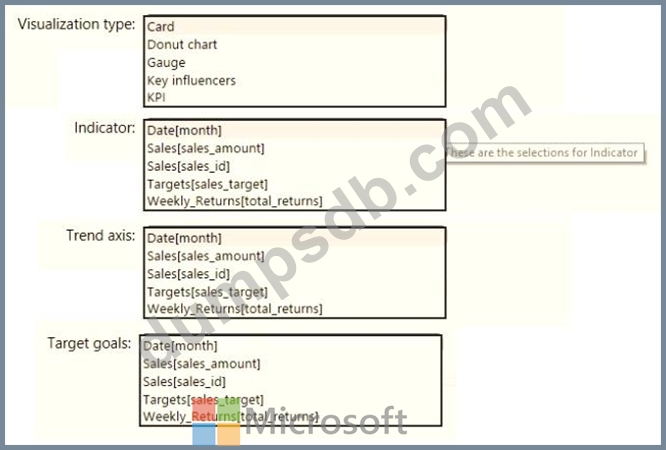

Question 19
You are creating a quick measure as shown in the following exhibit.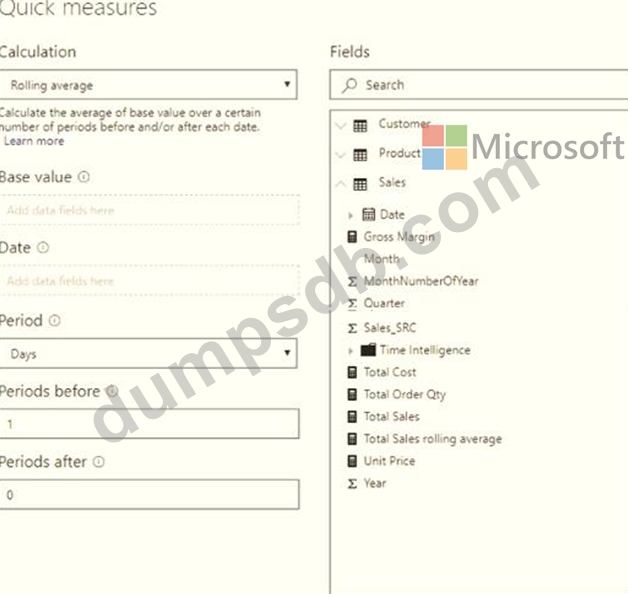
You need to create a monthly rolling average measure for Sales over time-How should you configure the quick measure calculation? To answer, select the appropriate options in the answer are a.
NOTE: Each correct selection is worth one point.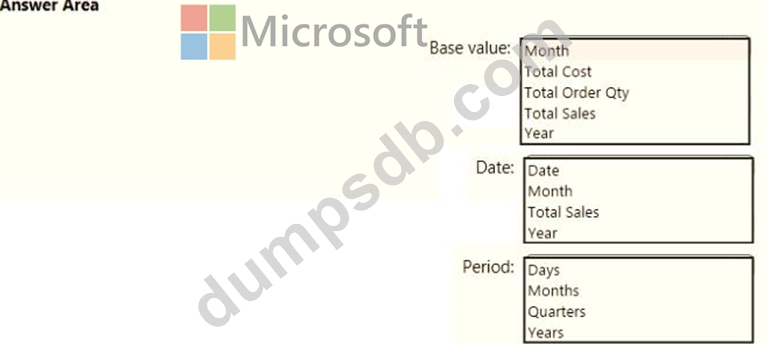

Question 20
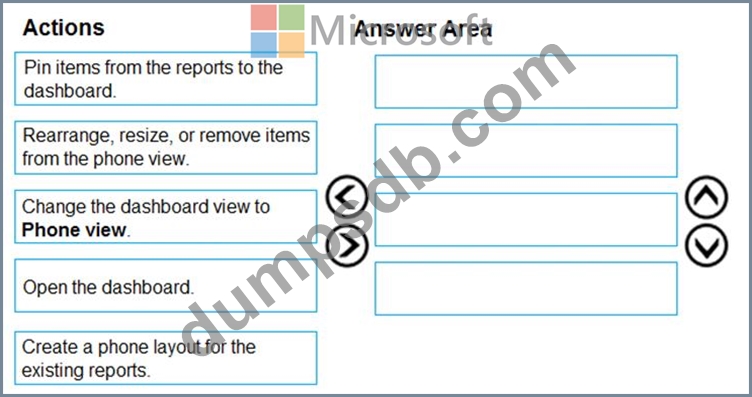
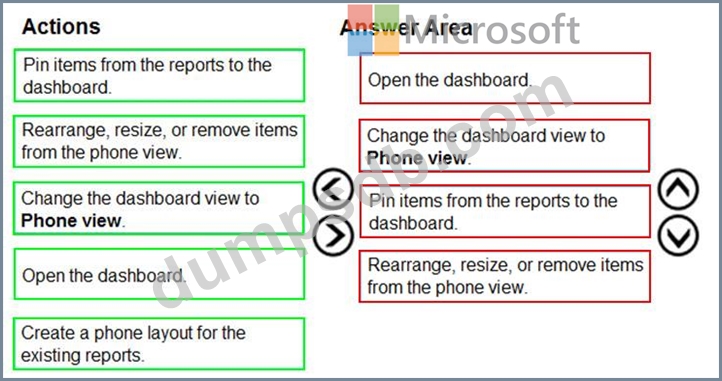
You are using existing reports to build a dashboard that will be viewed frequently in portrait mode on mobile phones.
You need to build the dashboard.
Which four actions should you perform in sequence? To answer, move the appropriate actions from the list of actions to the answer area and arrange them in the correct order.