Question 26
Your company plans to completely separate development and production assets such as datasets, reports, and dashboards in Microsoft Power Bl.
You need to recommend an application lifecycle strategy. The solution must minimize maintenance to update access and prevent end users from viewing the development assets.
What should you recommend?
Question 27
You have a dashboard that contains tiles pinned from a single report as shown in the Original Dashboard exhibit. (Click the Original Dashboard tab.)
You need to modify the dashboard to appear as shown in the Modified Dashboard exhibit. (Click the Modified Dashboard tab.)
What should you do?
Question 28
Drag and Drop Question
You build a report about warehouse inventory data. The dataset has more than 10 million product records from 200 warehouses worldwide.
You have a table named Products that contains the columns shown in the following table.
Warehouse managers report that it is difficult to use the report because the report uses only the product name in tables and visuals. The product name is contained within the ProductDescription column and is always the fourth value.
You need to modify the report to support the warehouse managers requirement to explore inventory levels at different levels of the product hierarchy. The solution must minimize the model size.
Which three actions should you perform in sequence? To answer, move the appropriate actions from the list of actions to the answer area and arrange them in the correct order.

Question 29
Note: This question is part of a series of questions that present the same scenario. Each question in the series contains a unique solution that might meet the stated goals. Some question sets might have more than one correct solution, while others might not have a correct solution.
After you answer a question in this section, you will NOT be able to return to it. As a result, these questions will not appear in the review screen.
You are modeling data by using Microsoft Power Bl. Part of the data model is a large Microsoft SQL Server table named Order that has more than 100 million records.
During the development process, you need to import a sample of the data from the Order table.
Solution: You write a DAX expression that uses the FILTER function.
Does this meet the goal?
Question 30
You are creating a column chart visualization.
You configure groups as shown in the Groups exhibit. {Click the Groups tab.)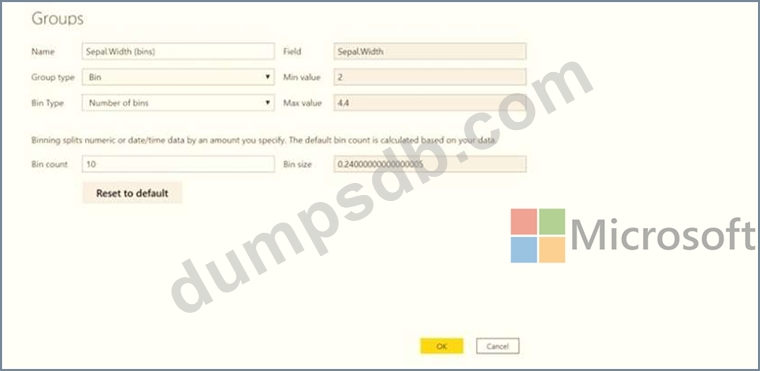
The visualization appears as shown in the Chart exhibit. (Click the Chart tab.)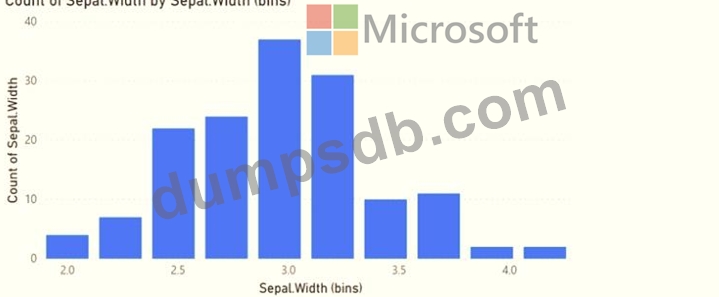
For each of the following statements, select Yes if the statement is true. Otherwise, select No.
NOTE: Each correct selection is worth one point.